Broker tools
TMI by city: Canadian office and industrial rent, 2026
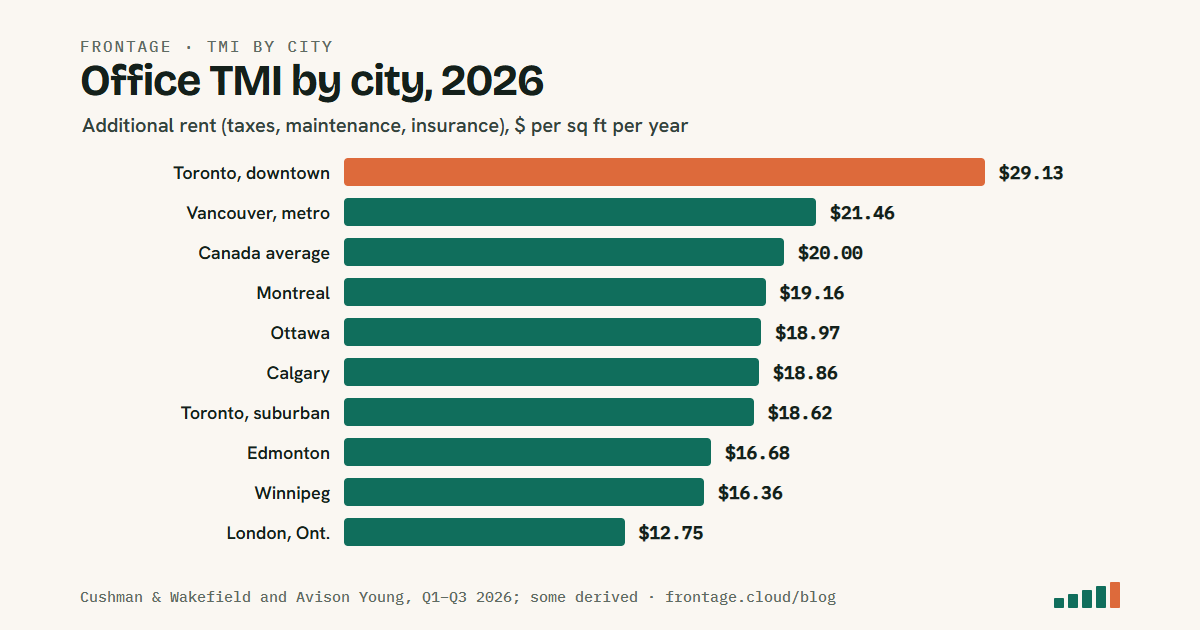
TMI, the taxes, maintenance and insurance a tenant pays on top of net rent, is not one number across Canada. On office space it ran from about $12.75 a square foot in London, Ontario to about $29 in downtown Toronto in 2026; on industrial, from under $3 to almost $8. Here are the latest published figures by market, office and industrial, every one sourced and dated, with what makes the cities differ and how to read the numbers.
Key takeaways
- Office TMI averaged $20.00 a square foot across Canada in Q2 2026, against $23.03 net rent [1].
- Downtown Toronto is the outlier: about $29.13 of TMI on a $72.48 gross rent in Q3 2026, derived from Cushman & Wakefield's figures [3].
- Industrial TMI is far lower, $4.94 on average [14], but ranges from $2.91 in Winnipeg to $7.94 in Halifax [14, 23].
- Property tax drives much of the gap. Commercial property is taxed at several times the residential rate, and the multiple differs by city [25, 26, 27].
- These are asking figures, averaged across building classes and weighted by vacant space [14, 4]; use them as a benchmark, not a quote.
Office TMI by city, 2026
| Market | Net rent | TMI | Gross rent | Period | Source |
|---|---|---|---|---|---|
| Canada, all markets | $23.03 | $20.00 | $43.03 | Q2 2026 | [1] |
| Toronto, downtown | $43.35 | about $29.13, derived | $72.48 | Q3 2026 | [3] |
| Toronto, suburban | $18.48 | about $18.62, derived | $37.10 | Q3 2026 | [3] |
| Vancouver, metro | about $33.33, derived | $21.46 | $54.79 | Q2 2026 | [4] |
| Montreal, greater | $20.19 | about $19.16, derived | $39.35 | Q2 2026 | [5] |
| Ottawa | $17.64 | $18.97 | $36.60 | Q2 2026 | [6] |
| Calgary | $16.13 | about $18.86, derived | $34.99 | Q2 2026 | [8] |
| Edmonton | about $16.25 | $16.68 | $32.93 | Q2 2026 | [9] |
| Winnipeg | $16.35 | about $16.36, derived | $32.71 | Q1 2026 | [10] |
| London, Ontario | $13.86 | $12.75 | $26.61 | Q3 2026 | [11] |
Three markets publish only a gross rent, with no split between net rent and TMI: Saskatoon at $38.58 in Q2 2026 [1], Halifax at $31.93 in Q3 2026 [12] and Waterloo Region at $29.63 in Q2 2026 [13]. Publishers differ, too: for Ottawa office, Cushman & Wakefield puts TMI at $18.97 [6] and Avison Young at $19.95 [7]. Avison Young's six-market national average net rent was $24.00 [2].
Industrial TMI by city, 2026
| Market | Net rent | TMI | Period | Source |
|---|---|---|---|---|
| Canada, all markets | $14.82 | $4.94 | Q2 2026 | [14] |
| Greater Vancouver | $18.87 | $6.16 | Q2 2026 | [15] |
| Fraser Valley | $18.22 | $5.66 | Q2 2026 | [15] |
| Calgary | $10.68 | $4.92 | Q2 2026 | [16] |
| Edmonton | $11.72 | $4.99 | Q2 2026 | [17] |
| Saskatoon | $14.16 | $5.12 | Q2 2026 | [14] |
| Winnipeg | $10.55 | $2.91 | Q2 2026 | [14] |
| Greater Toronto Area | $16.03 | $4.28 | Q2 2026 | [18] |
| Hamilton | $12.78 | $3.42 | Q2 2026 | [18] |
| Waterloo Region | $13.63 | $3.72 | Q2 2026 | [19] |
| London, Ontario | $10.77 | $3.87 | Q3 2026 | [20] |
| Ottawa | $16.75 | $6.19 | Q2 2026 | [21] |
| Montreal | $14.06 | $4.68 | Q2 2026 | [22] |
| Halifax | $15.05 | $7.94 | Q2 2026 | [23] |
Treat the Winnipeg row with care: the national report's $2.91 sits well below the $4.00 in Cushman & Wakefield's own Winnipeg report for the quarter before [14, 24].
What it means on a real lease
Our arithmetic, from the tables above. A 5,000 square foot office pays about $145,650 a year in TMI downtown Toronto, about $93,100 in suburban Toronto and $63,750 in London, Ontario, before a dollar of net rent [3, 11]. A 20,000 square foot warehouse pays about $158,800 a year in TMI in Halifax and $85,600 in the Greater Toronto Area [23, 18]. Two buildings quoted at the same net rent can be tens of thousands of dollars apart once TMI is in, which is why offers should be compared on gross and net effective rent, not net rent alone.
Why TMI differs from city to city
Property tax. Taxes are the largest part of TMI, and cities tax commercial property at very different multiples of residential. In Altus Group's 2023 survey of 11 cities, the commercial-to-residential ratio averaged 2.82, from 4.33 in Montreal to 1.50 in Regina [25]. In 2026, Toronto set its commercial ratio at 2.31 and its industrial ratio at 2.50 times residential [26]; from Calgary's 2026 rates, non-residential property pays about 3.3 times the residential rate, by our calculation [27].
Operating costs move gross rent on their own. In Edmonton, net office rent held at about $16.25 in Q2 2026 while gross rent eased, "primarily attributable to lower operating costs", which fell to $16.68 [9].
Downtown and suburban differ mostly on net rent. In Ottawa, Avison Young found that additional rents "remain relatively consistent across submarkets", while downtown net rents run about 35 to 40% above the suburbs [7].
Insurance is not what is pushing TMI up in 2026. Commercial insurance rates in Canada fell 6% in Q1 2026, and property rates slipped 6% [28].
How to read these numbers
- Office and industrial are measured differently. Cushman & Wakefield's office rents are gross, full-service asking rents; its industrial rents are net (NNN) asking rents with TMI shown beside them [1, 14]. Do not compare an office row with an industrial row directly.
- They are asking rents, before free rent and other inducements [4], and they are averages weighted by available space, so a change in what is vacant can move the average without any rent changing [15].
- Periods differ by row, because each city report comes out on its own schedule. Each row shows its quarter.
- "Derived" means our subtraction of net rent from gross rent in the same report.
We update this page as new quarterly reports are published. For what TMI covers and how it is negotiated, see TMI in real estate: what it means and what it costs; to check the year-end bill, see How to check a TMI reconciliation.
Questions
How much is TMI per square foot in Canada?
For office, Cushman & Wakefield put the Canadian average at $20.00 per square foot per year in Q2 2026, on top of $23.03 net rent. For industrial, the average was $4.94 on top of $14.82 net rent.
What is TMI on an office lease in Toronto?
About $29.13 per square foot per year downtown and about $18.62 in the suburbs in Q3 2026, derived from Cushman & Wakefield's gross and net asking rents.
Why is TMI higher downtown?
Downtown office buildings carry higher property taxes and operating costs per square foot. In Ottawa, though, Avison Young found additional rent fairly consistent across submarkets, with the downtown premium mostly in net rent.
Is industrial TMI lower than office TMI?
Much lower. Across Canada, industrial TMI averaged $4.94 per square foot against $20.00 for office in Q2 2026, because industrial buildings have fewer shared services and less common area.
Which Canadian city has the highest industrial TMI?
Of the markets listed here, Halifax: $7.94 per square foot in Q2 2026, against a national average of $4.94.
Are these TMI figures what tenants actually pay?
They are averages of asking figures across available space. A specific building's TMI depends on its taxes, age, services and the lease, so ask the landlord for the current budget and last year's actual statement.
The free net effective rent calculator shows TMI beside net rent, so two offers with different TMI are compared on what the tenant will actually pay.
Sources
Quarterly market reports, municipal tax sources and industry press, current to 9 October 2026. Where a figure is derived rather than published, the table says so.
- Cushman & Wakefield, Canadian National Office MarketBeat Q2 2026, Q2 2026.
- Avison Young, Canadian office market report Q2 2026, Q2 2026.
- Cushman & Wakefield, Toronto Office MarketBeat Q3 2026, Q3 2026.
- Avison Young, Metro Vancouver office report Q2 2026, Q2 2026.
- Avison Young, Montréal office market report Q2 2026, Q2 2026.
- Cushman & Wakefield, Ottawa Office MarketBeat Q2 2026, Q2 2026.
- Avison Young, Greater Ottawa office market report Q2 2026, Q2 2026.
- Cushman & Wakefield, Calgary Office MarketBeat Q2 2026, Q2 2026.
- Cushman & Wakefield, Edmonton Office MarketBeat Q2 2026, Q2 2026.
- Cushman & Wakefield, Winnipeg Office MarketBeat Q1 2026, Q1 2026.
- Cushman & Wakefield, London Office MarketBeat Q3 2026, Q3 2026.
- Cushman & Wakefield, Halifax Office MarketBeat Q3 2026, Q3 2026.
- Cushman & Wakefield, Waterloo Region Office MarketBeat Q2 2026, Q2 2026.
- Cushman & Wakefield, Canadian National Industrial MarketBeat Q2 2026, Q2 2026.
- Cushman & Wakefield, Vancouver Industrial MarketBeat Q2 2026, Q2 2026.
- Cushman & Wakefield, Calgary Industrial MarketBeat Q2 2026, Q2 2026.
- Cushman & Wakefield, Edmonton Industrial MarketBeat Q2 2026, Q2 2026.
- Cushman & Wakefield, Toronto Industrial MarketBeat Q2 2026, Q2 2026.
- Cushman & Wakefield, Waterloo Region Industrial MarketBeat Q2 2026, Q2 2026.
- Cushman & Wakefield, London Industrial MarketBeat Q3 2026, Q3 2026.
- Cushman & Wakefield, Ottawa Industrial MarketBeat Q2 2026, Q2 2026.
- Cushman & Wakefield, Montréal Industrial MarketBeat Q2 2026, Q2 2026.
- Cushman & Wakefield, Halifax Industrial MarketBeat Q2 2026, Q2 2026.
- Cushman & Wakefield, Winnipeg Industrial MarketBeat Q1 2026, Q1 2026.
- Altus Group, Canadian Property Tax Rate Benchmark Report 2023 (release), Oct 11, 2023.
- City of Toronto, Budget implementation including property tax rates (report for action), Feb 6, 2026.
- City of Calgary, Property tax rates and bill calculation, 2026 rates.
- Canadian Underwriter (Insurance Institute of Canada), How Canada's commercial coverage rates fared in Q1 2026, Apr 23, 2026.
General information for real estate professionals and tenants, not legal, tax, accounting or commercial real estate advice. Figures are as published by each source at the dates shown and have not been independently verified. Lease terms and laws differ by province and by lease: read the lease itself and consult a qualified adviser before acting or advising a client.